About
Hello!
My name is Georgios Fotopoulos and welcome to my personal portfolio.
I am an experienced Data Analyst with a demonstrated history of working in the Information Technology and services industry. Having a Master's degree in Data Science and a Bachelor's degree in Computer Science and about 8 years of hands-on experience, have helped me to build a strong background in supporting business solution software and analyzing business operations.
Contact me
| Contact method | |
|---|---|
| geo.fot@gmail.com | |
| Phone | +306977569249 |
| https://www.linkedin.com/in/giorgos-fotopoulos/ |
Index
This repository holds all of my personal projects that I have done so far. Currently they have binned in three different categories:
- Machine Learning
- Regression and Classification
- Exploratory Data Analysis
- Computer vision
- Databases
- SQL (PostgreSQL)
- NoSQL (MongoDB, Elasticsearch, Solr)
- Data Visualization
- Power BI
- Tableau
- Kibana
Machine Learning
This repository contains some of the most typical tasks in Machine Learning, Classification and Regression, along with Exploratory Data Analysis, Algorithm comparison and Computer vision, using some of the most popular datasets like “Bike Sharing”, “Breast cancer”, “Diabetes” and the “MNIST” dataset.
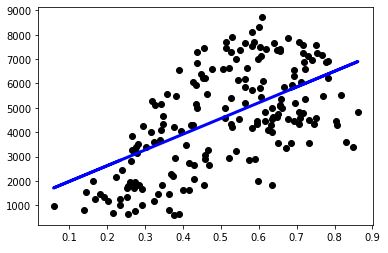
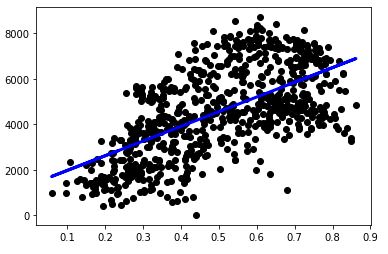
Regression and Classification
Training different models using Decision Trees, Linear regression and Logistic regression and plot the loss (𝑦−𝑦̂) with respect to the training epochs, for each one of the regression models. For all these tasks the “Bike Sharing” dataset has been used.
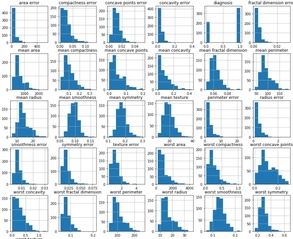
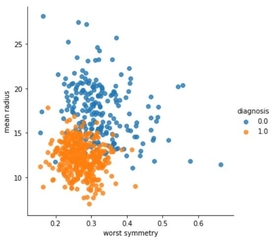
Exploratory Data Analysis
In this task, we apply Exploratory Data Analysis (EDA) as an approach of analyzing the datasets, by investigating the dimensions of the data, the data types and their statistical properties. Moreover, after choosing a set of classification and regression algorithms to compare in terms of their accuracy, we train and evaluate the selected models. For both these tasks the “Breast cancer” and “Diabetes” dataset have been used.
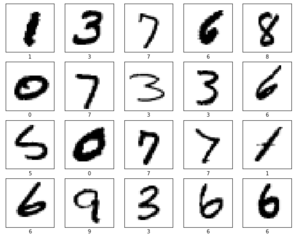
Computer vision
A typical Computer Vision problem using the “MNIST” dataset. The aim of this task is to correctly identify digits from a dataset of handwritten images. Again, we apply EDA together with algorithm comparison and selection to train and evaluate the best model, which in this case, is proved to be the k-NN.
Data Visualization
This repository contains samples for my Data Visualization projects and reports using real-world data, created with Power BI, Tableau and Kibana.
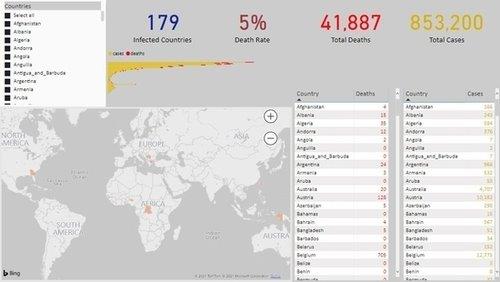
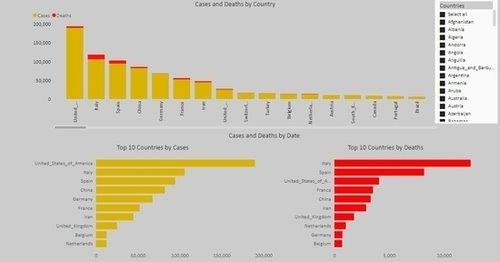
Power BI
In this project, we created dashboards related to Covid-19 pandemic that provide up-to-date data about coronavirus infections and deaths worldwide, using the Data Visualization tool Power BI. Data can be filtered by country, or even by cases and deaths and also the top 10 countries are presented.
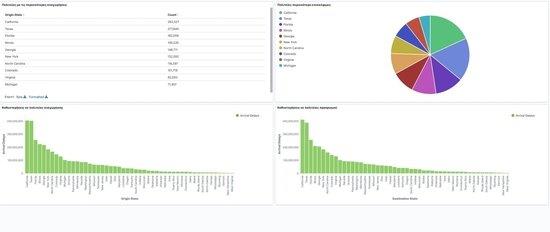
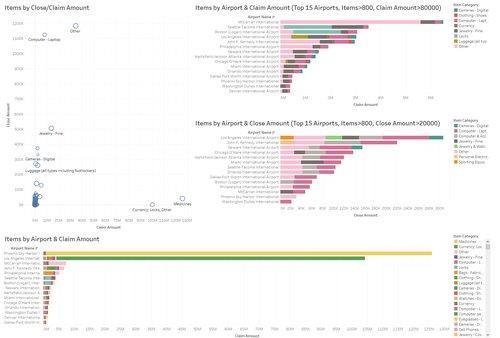
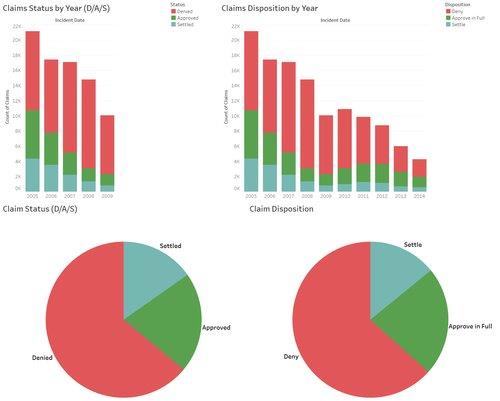
Tableau
Next, information around the TSA Claims Data, compiled by the Department of Homeland Security of the United States are visualized. The datasets contain data about the years 2002-2014 and the dashboards we created, categorize claims by year, claims by airport, claims status by year, items by claim amount, and items by airport. To perform this project we used the Data Visualization tool Tableau.
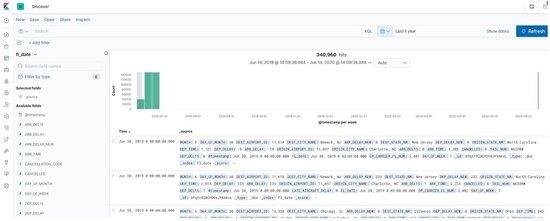
Kibana
In this project, we created dashboards around the causes of flight delays and cancellations in flight problems due to severe weather conditions, using the Data Visualization tool Kibana.